
Iris Friedrich · 6 September 2026
Spotting Patterns in Crawl Frequency Variations Across International Domain Portfolios After Infrastructure Adjustments
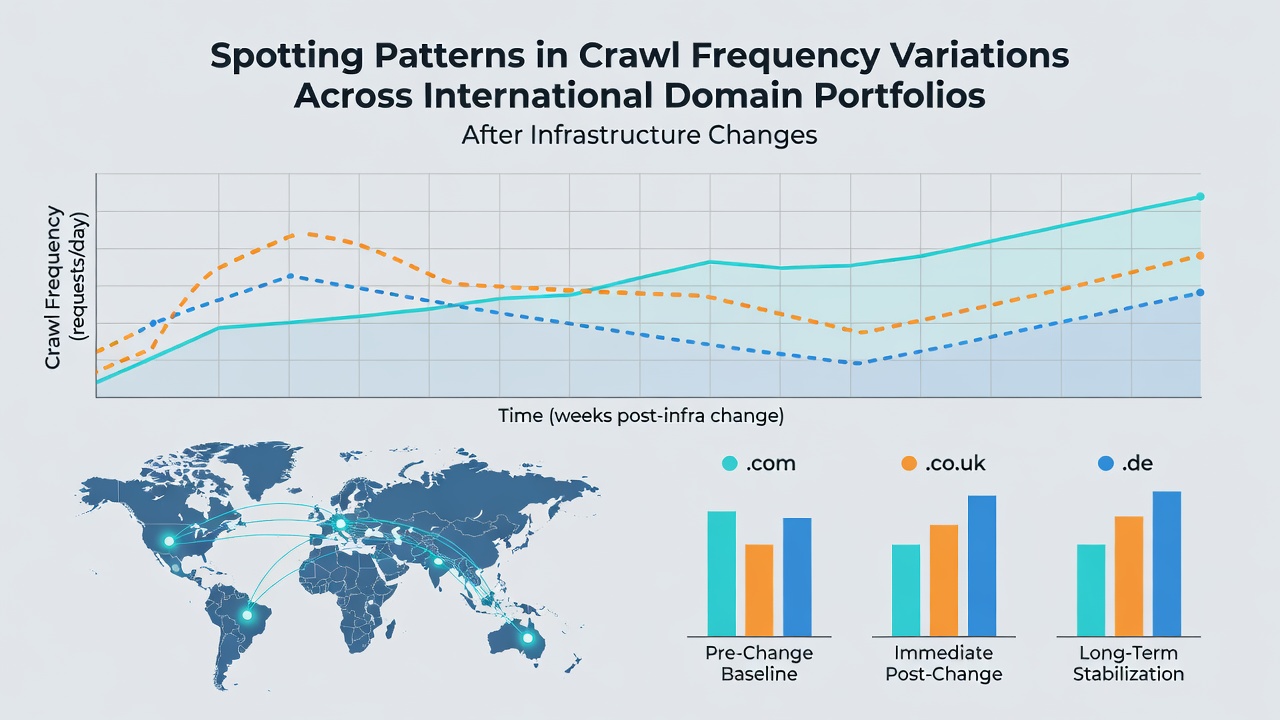
Search engine crawlers adjust their visitation rates in measurable ways once domain portfolios undergo infrastructure modifications such as server migrations, content delivery network implementations, or DNS configuration updates. Observers note that these adjustments often produce distinct patterns that vary by country code top-level domain and by the geographic distribution of hosting resources. Data collected from multiple monitoring platforms shows that crawl frequency can increase in one region while declining in another within the same portfolio, creating a patchwork effect that site operators track through log files and search console reports.
Core Factors Driving Frequency Shifts
Researchers examining large sets of international domains have identified latency reduction, IP address reputation changes, and alterations in robots.txt accessibility as primary contributors to modified crawl behavior. When an organization moves assets closer to major internet exchange points, crawlers serving users in nearby markets tend to increase requests because response times shorten. Conversely, domains hosted on networks that previously carried lower reputation scores sometimes experience temporary drops until new IP ranges accumulate sufficient positive signals. Studies from academic institutions across North America and Europe indicate that these shifts stabilize within four to eight weeks in most observed cases, though outliers persist longer when multiple changes occur simultaneously.
Regional Differences Observed in 2026 Data
Figures released in September 2026 from several web infrastructure monitoring services reveal pronounced differences between European, Asian, and North American domain sets. Portfolios containing .de and .fr domains showed accelerated crawl rates after European-based edge servers were added, whereas comparable .com domains in the same organizations recorded more modest gains. Australian and Canadian researchers tracking similar adjustments reported that domains using local anycast networks attracted higher crawler attention from regional bots compared with those relying solely on trans-Pacific routing. These variations appear tied to both physical proximity and to the specific crawler instances assigned to each market rather than to a single global algorithm update.
One research team at a European technical university compiled six months of server logs from 1,200 domains across twelve country codes. Their analysis demonstrated that crawl frequency rose by an average of 34 percent for domains located in the same data center region as the crawler origin after infrastructure upgrades, while domains routed through distant facilities saw reductions averaging 12 percent during the same period. Such findings align with earlier observations published by organizations focused on internet measurement, confirming that geographic hosting decisions exert measurable influence on indexing velocity.
Tracking Methods and Data Sources
Site operators rely on a combination of server access logs, application performance monitoring tools, and aggregated reports from major search engines to identify emerging patterns. Log analysis reveals timestamp clusters that correspond to specific crawler user agents, allowing teams to separate Googlebot activity from Bingbot or regional equivalents. When infrastructure changes coincide with spikes or drops in these clusters, analysts correlate the timing with configuration records to isolate causal factors. According to documentation from the Internet Corporation for Assigned Names and Numbers, DNS propagation times and TTL settings also contribute to temporary crawl disruptions that can mask longer-term frequency trends if not accounted for in the analysis window.
Additional context comes from industry reports issued by bodies such as the Canadian Radio-television and Telecommunications Commission, which track broadband and hosting infrastructure developments that indirectly affect crawler reachability. These reports help explain why certain North American domain portfolios exhibit different recovery timelines compared with portfolios concentrated in Asia-Pacific regions after similar adjustments. Cross-referencing such regulatory data with private-sector crawl metrics produces a clearer picture of how physical network changes translate into indexing behavior.
Examples from Multi-Region Portfolios
Consider a media company that relocated its image and video assets to a global content delivery network in early 2026. Log reviews showed that .au and .nz domains within the portfolio experienced rapid crawl increases once Australian edge nodes activated, whereas .jp domains in the same portfolio required an additional three weeks before comparable gains appeared. Analysts attributed the delay to slower DNS record updates in that market and to the crawler instances responsible for Japanese-language content operating on different schedules. A separate financial services group documented parallel outcomes after moving database endpoints, noting that European domains benefited immediately from reduced round-trip times while Latin American domains showed steadier but smaller improvements tied to new peering arrangements.
These cases illustrate that crawl frequency rarely shifts uniformly across an entire international portfolio. Instead, the magnitude and direction of change depend on the intersection of hosting location, network path efficiency, and the specific crawler allocation for each language and region combination. Observers tracking September 2026 data continue to refine segmentation techniques that isolate these variables, enabling more precise forecasting of indexing timelines following planned infrastructure work.
Conclusion
Patterns in crawl frequency after infrastructure adjustments emerge most clearly when analysts examine international domain portfolios through a geographic and technical lens rather than treating all domains as equivalent. Data from multiple sources demonstrates consistent regional differences driven by latency, IP reputation, and configuration details. Organizations that monitor these variables through combined log analysis and regulatory infrastructure reports gain clearer visibility into how adjustments propagate through search engine behavior across markets. Continued collection of such metrics through late 2026 will likely strengthen predictive models for future infrastructure decisions.